
Monthly management reporting · Retail, wholesale, distribution
Know what’s really happening in your business. Every day.
Monthly management reporting for retail, wholesale and distribution companies, with sales tracked daily wherever your systems can feed them. You make decisions based on what your numbers actually mean, not just what was filed last quarter.
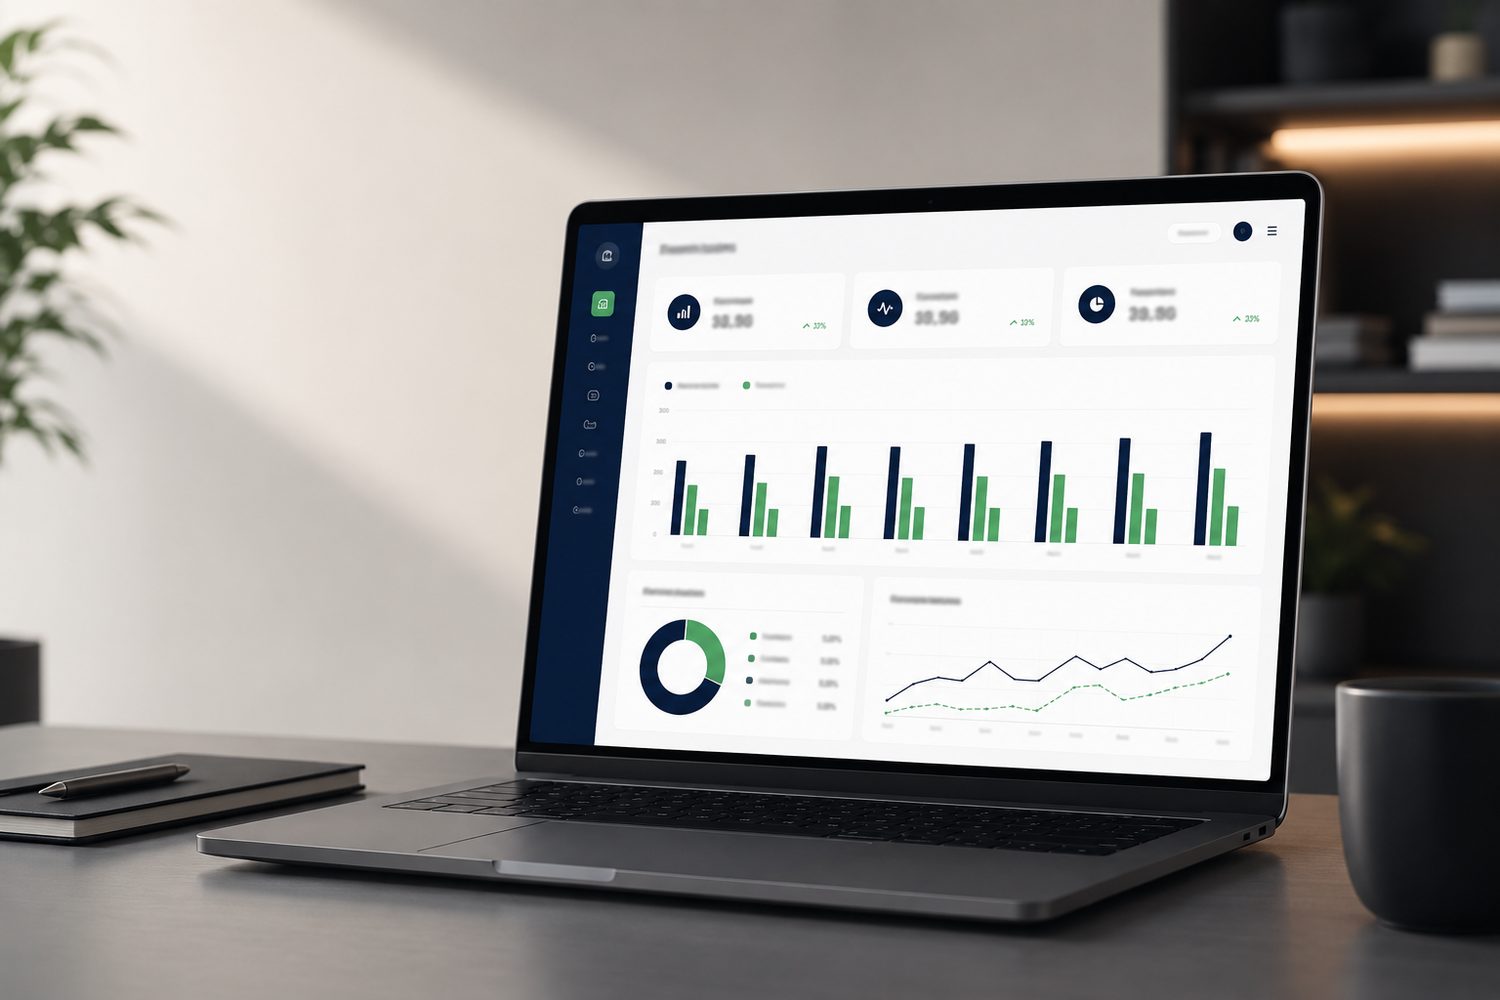
You can only fix what you can see.The idea Reportive is built on
The gap
Statutory accounts tell you what happened. They do not tell you what to do next.
The information already exists, in the trial balance, the sales ledger and the stock file. It is not in a form anyone outside the accounts office can use.
Reporting arrives after the decision
Pricing, purchasing and payroll are decided now. A filing that closes weeks later informs none of them.
Turnover is visible, margin is not
Which customers, products and branches actually contribute is a separate question, and in most businesses an unanswered one.
Profit is not cash
Stock, credit terms and repayments decide what reaches the bank. None of them appear in the profit and loss.
The product
Every question you ask of the business, answered in one place.
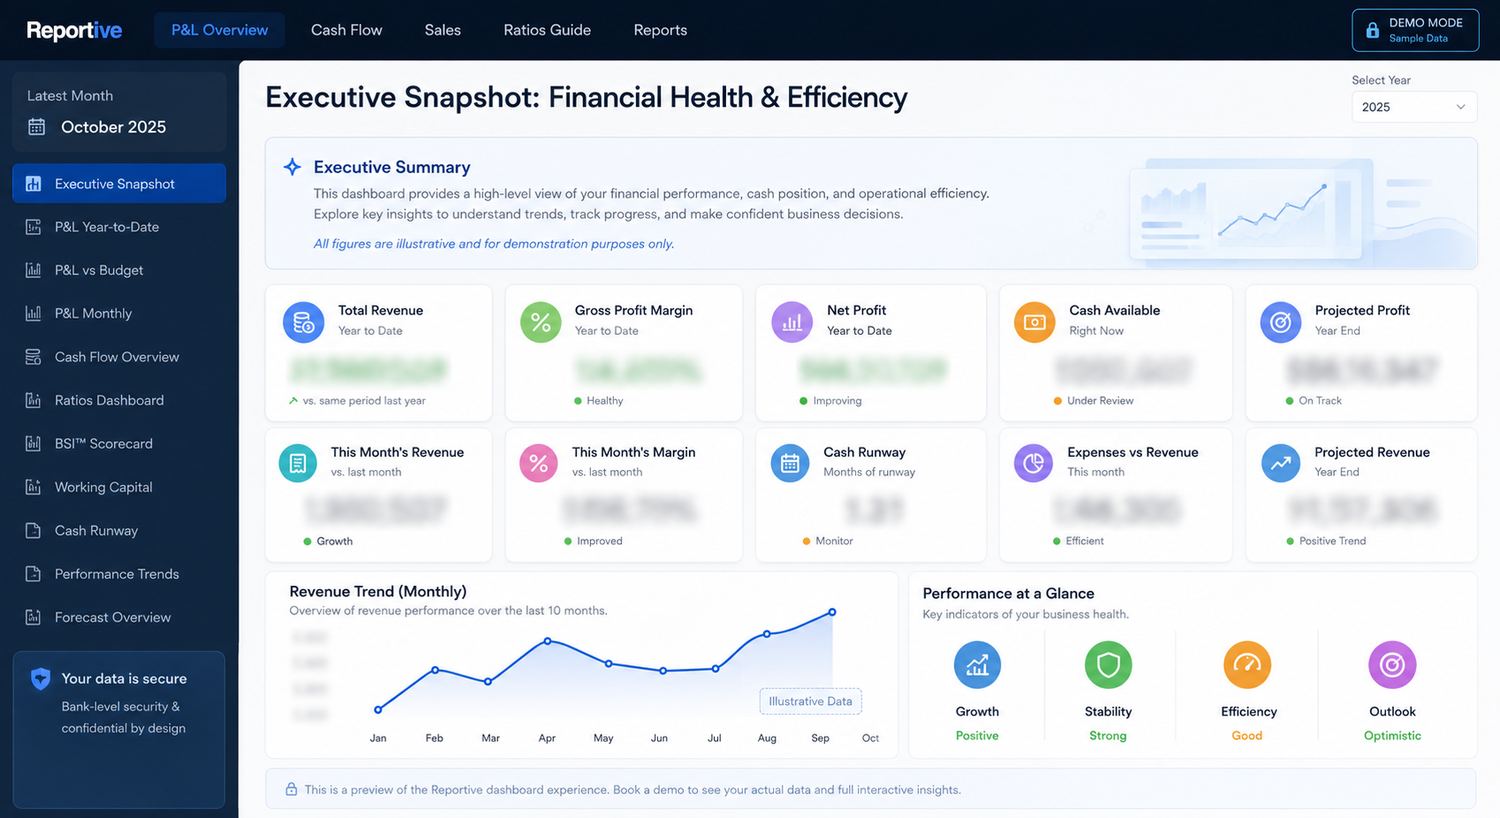
Your own data, refreshed monthly, in the language you work in. Below is the demo account with figures replaced.
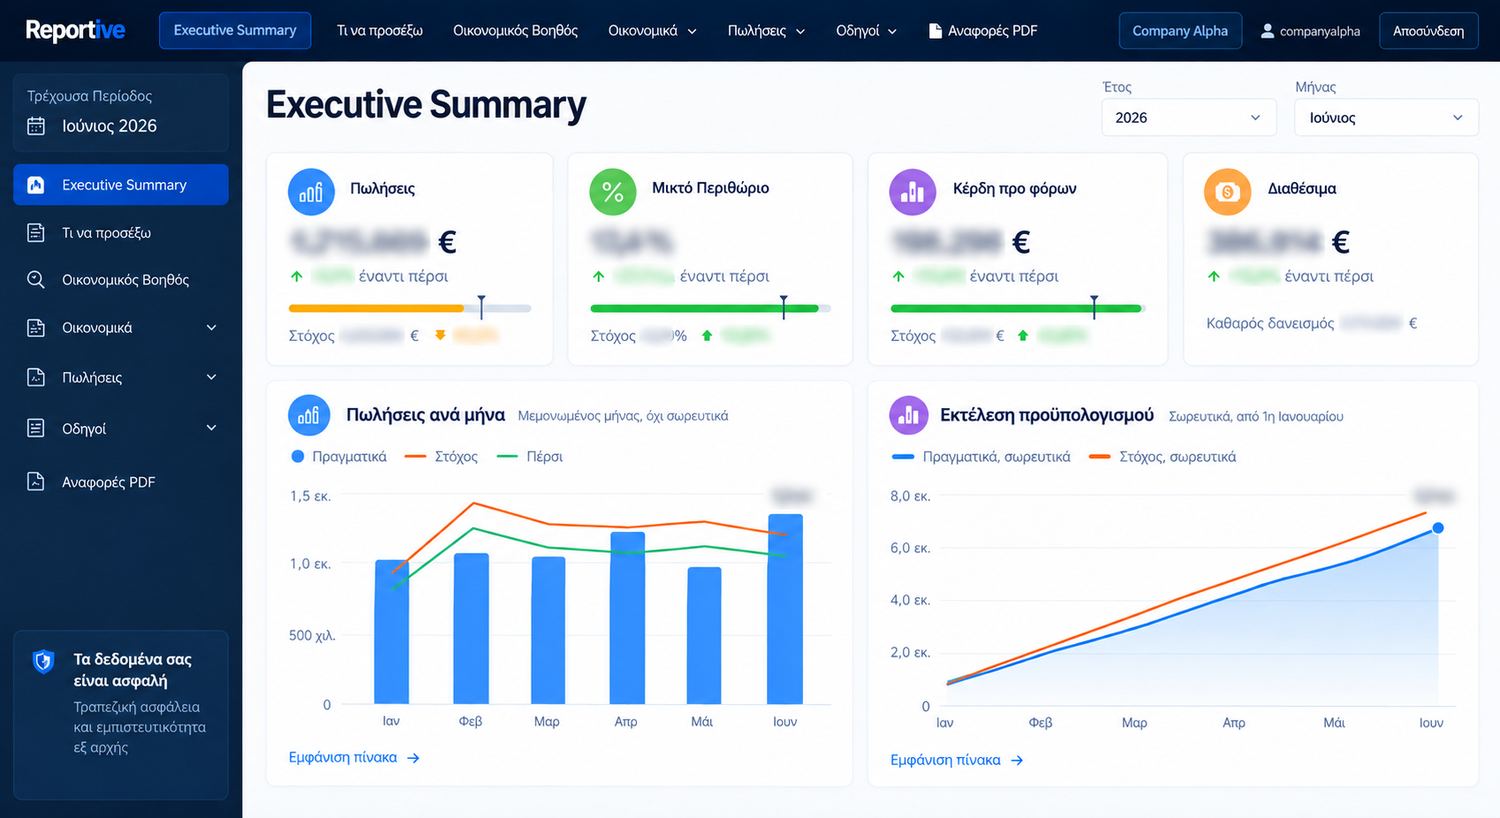
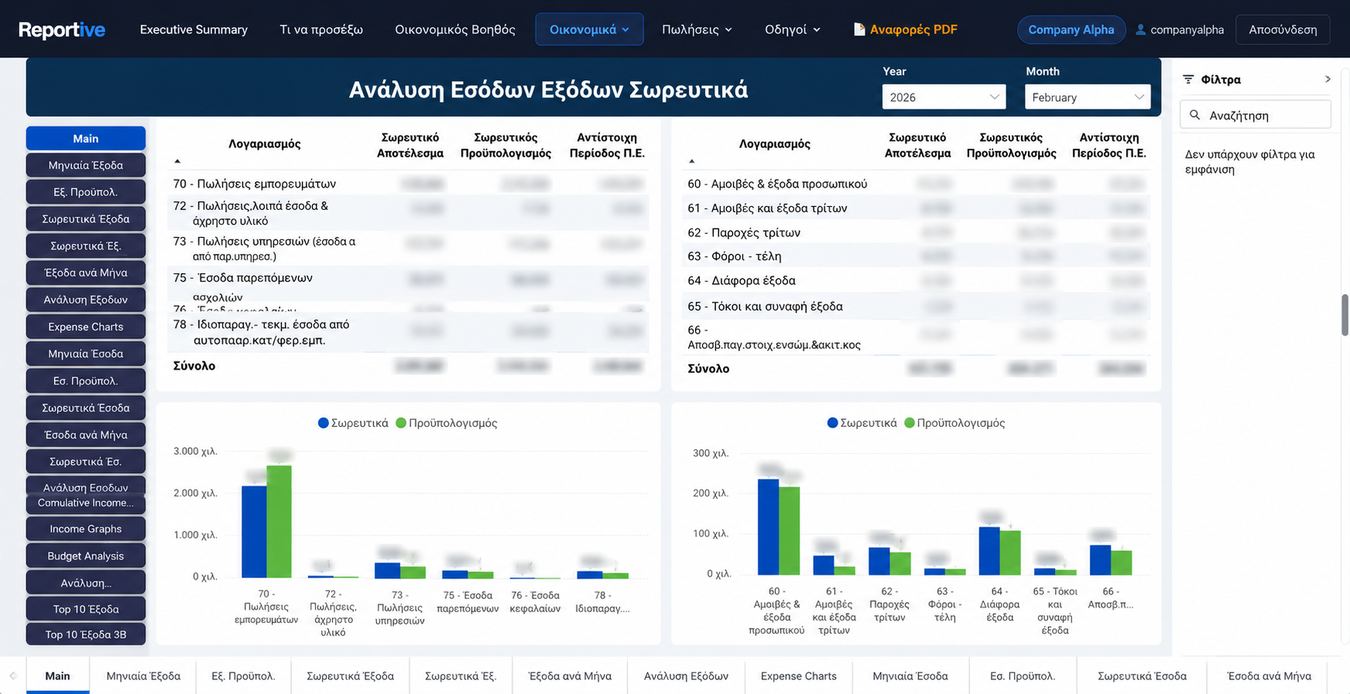
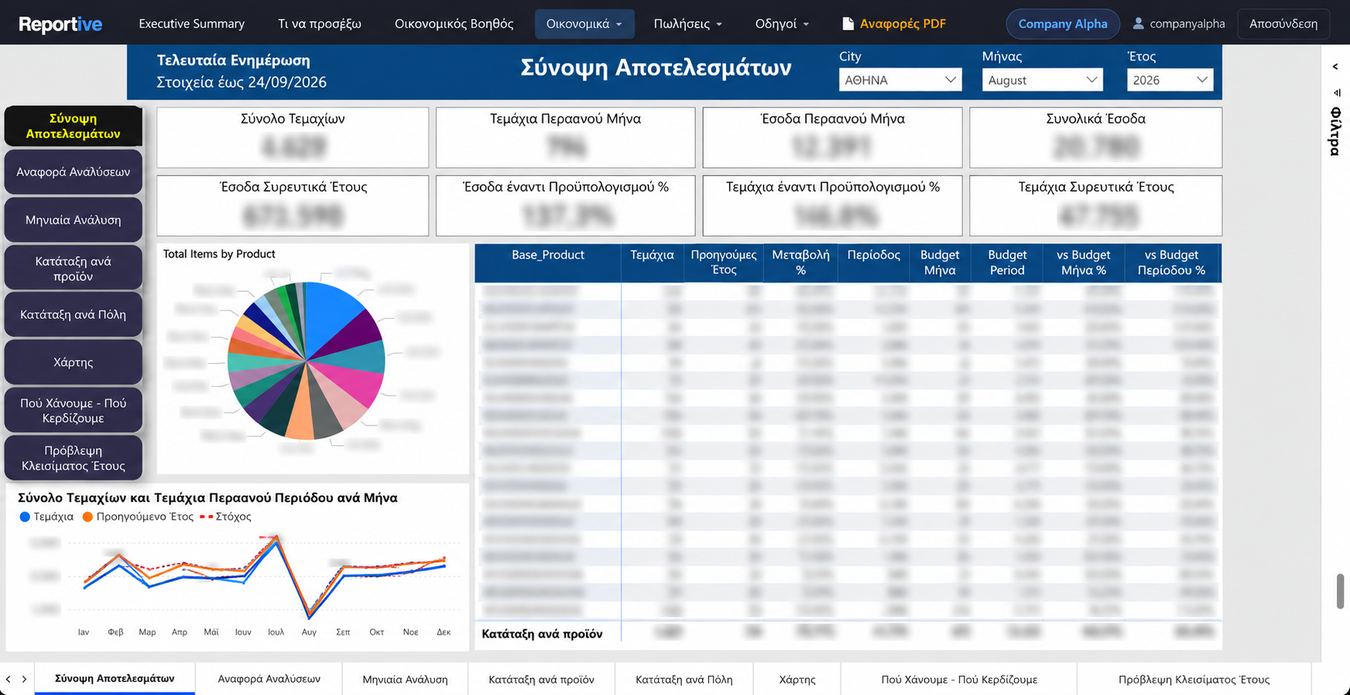
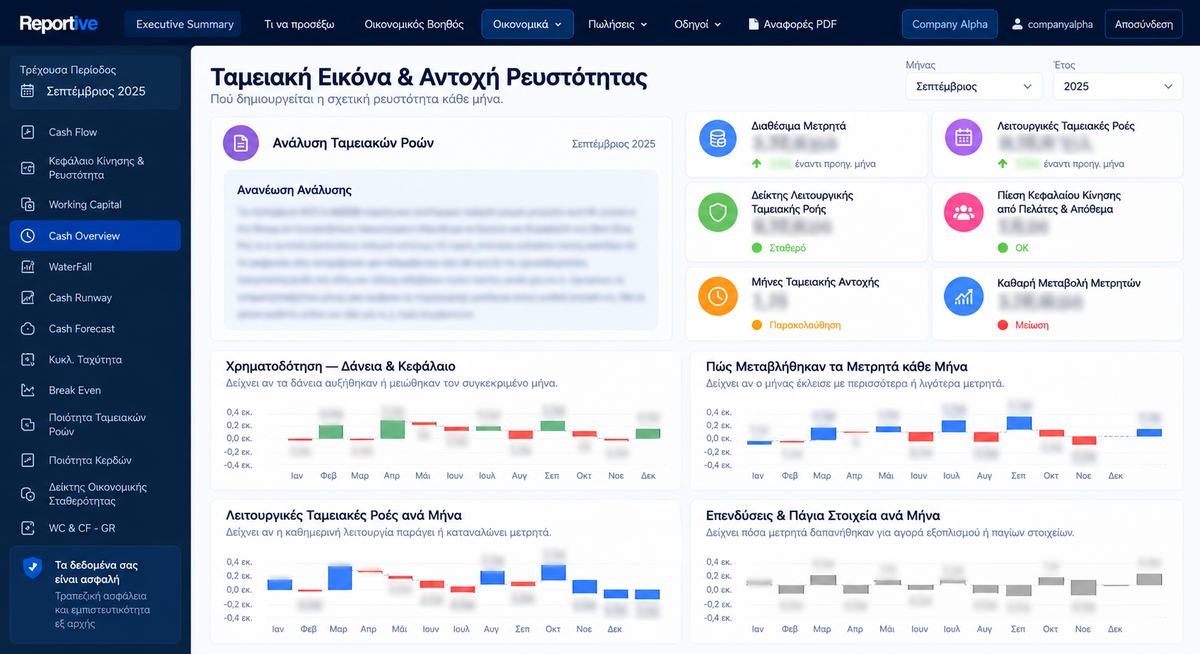
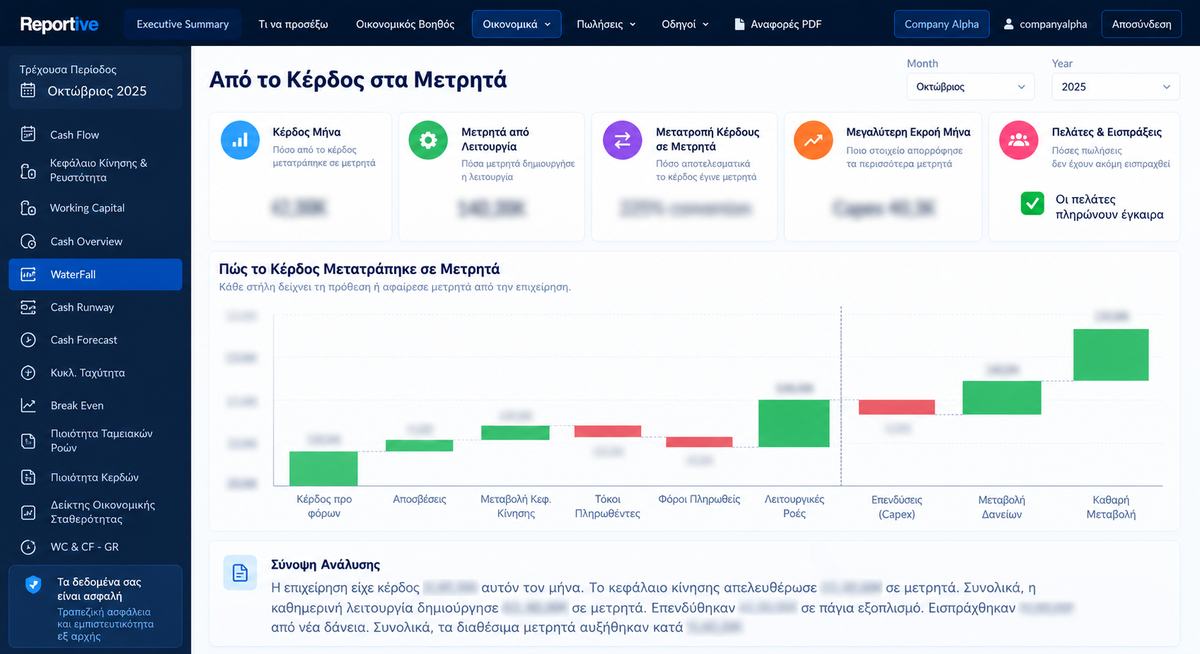
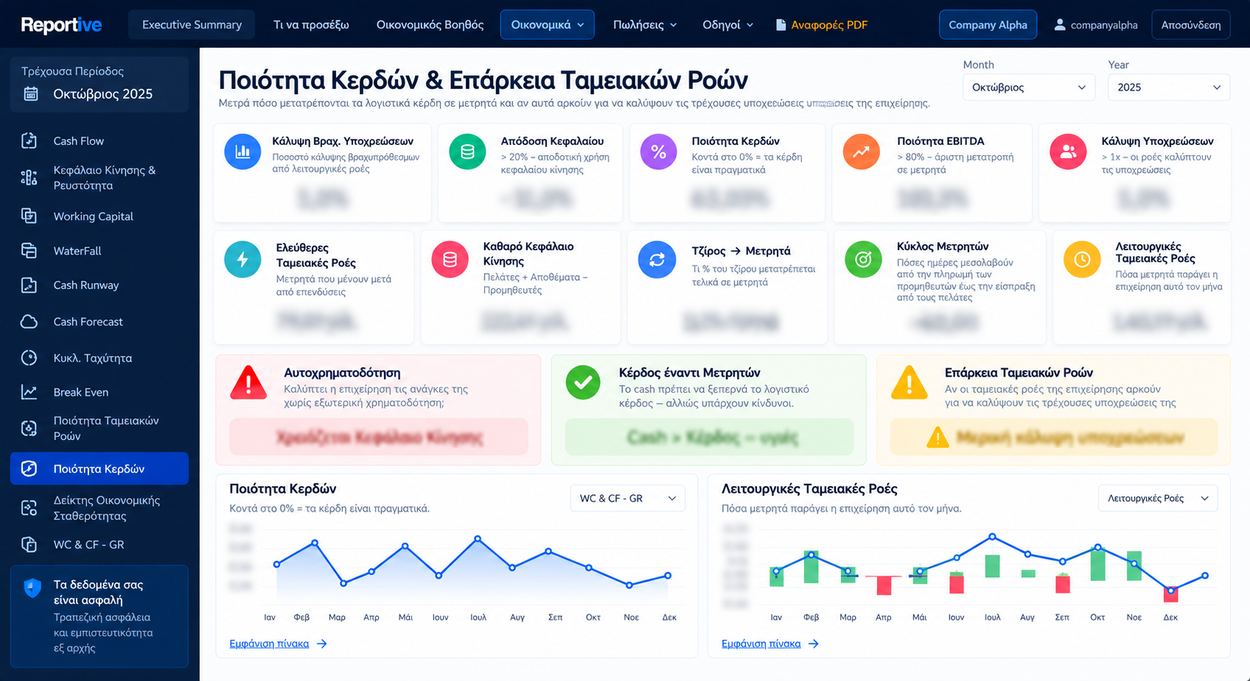
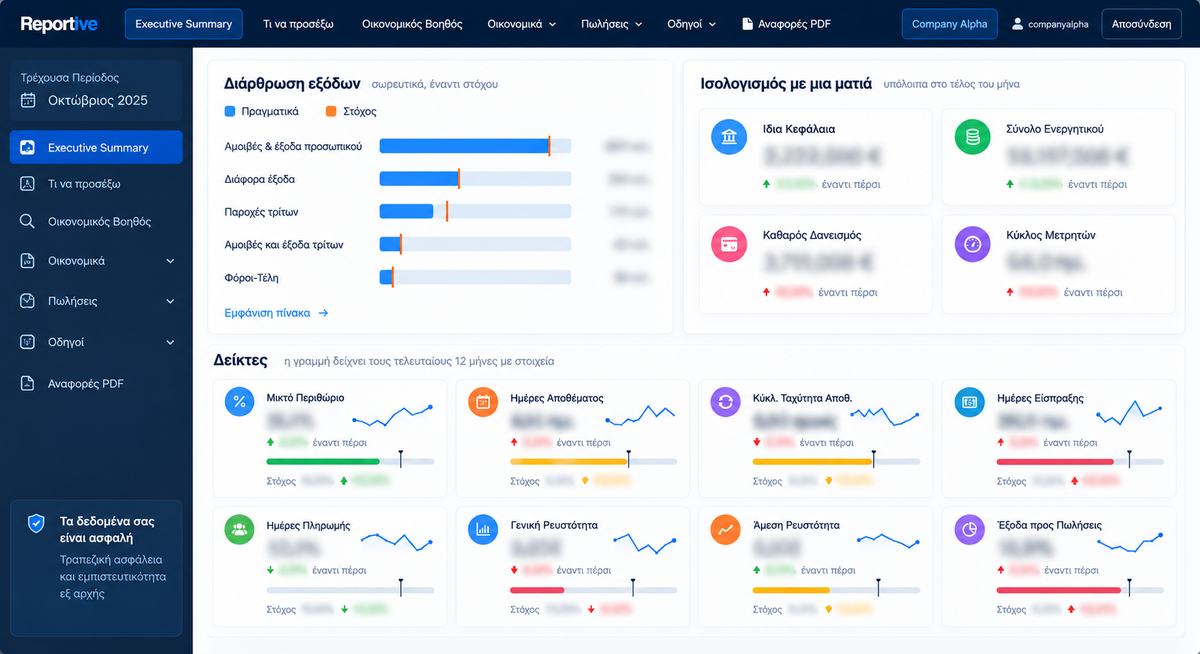
Demo account. All figures are illustrative.
Free tool
The Business Stability Index (BSI): one number for how solid the business actually is.
Seven weighted indicators, scored from your last balance sheet and P&L, combined into a rating from AA down to H. It takes about five minutes and you get the full breakdown by email.
What you get
What arrives every month.
P&L and balance sheet
Monthly results against budget and against last year, built from the trial balance, with the health indicators an owner should be watching.
Cash flow and liquidity
Where the cash came from, where it went, how many months of runway remain and which early warning is worth acting on now.
Sales performance
Revenue and margin by location, product, channel, customer and salesperson. Where the data can be fed daily, the sales team works from today’s position instead of last month’s.
Cost centre control
Costs and contribution by department, so each manager sees their own numbers and the conversation stops running on opinions.
Written monthly review
A plain language note on what moved, why it moved and the two or three things worth doing about it before the month is out.
BSI scorecard
The stability score tracked over time, so you can see whether the business is getting stronger or quietly getting more fragile.
The difference
A dashboard shows you the number. Reportive tells you what it means.
Every client dashboard carries a written analysis, generated from that month's figures and reviewed before it reaches you. It is the part most reporting tools leave to the owner to work out alone.
The business made a profit this month. Working capital released cash, day to day operations generated more, equipment was bought outright, and the balance closed higher than it opened. In one paragraph, in your own language.
How it works
Three steps, then it runs every month.
We take your data as it is
Trial balance, sales ledger, stock file, straight from your accounting software. No new system to buy and nothing for your team to re-key.
We build your reporting model
Your chart of accounts, your budget, your targets, your locations. The dashboards go live and keep being shaped around the way you run the business.
You get the month, explained
Financial dashboards refreshed monthly, sales daily where the data allows, the written review, and a call if you want one. Your accountant keeps doing exactly what they do today.
Fit
Who this is built for.
Built for
- Retail, wholesale or distribution, where stock, credit terms or multiple locations complicate the picture
- Books kept properly, but reporting stops at the statutory accounts
- An owner or MD who makes the decisions and wants them grounded
- Growth or pressure that the annual accounts no longer explain
Not a fit
- A finance team that already produces monthly management accounts
- Bookkeeping months behind, which has to be corrected first
- A one off report for the bank rather than an ongoing view
- A tool to install rather than a service that runs
Understand the past. Command the present. Shape the future.
Send one month of data. See your own business in the dashboards.
A trial balance and one month of sales is enough to build a working preview. Nothing to commit to before you have seen your own figures.