Financial Analysis & Reporting
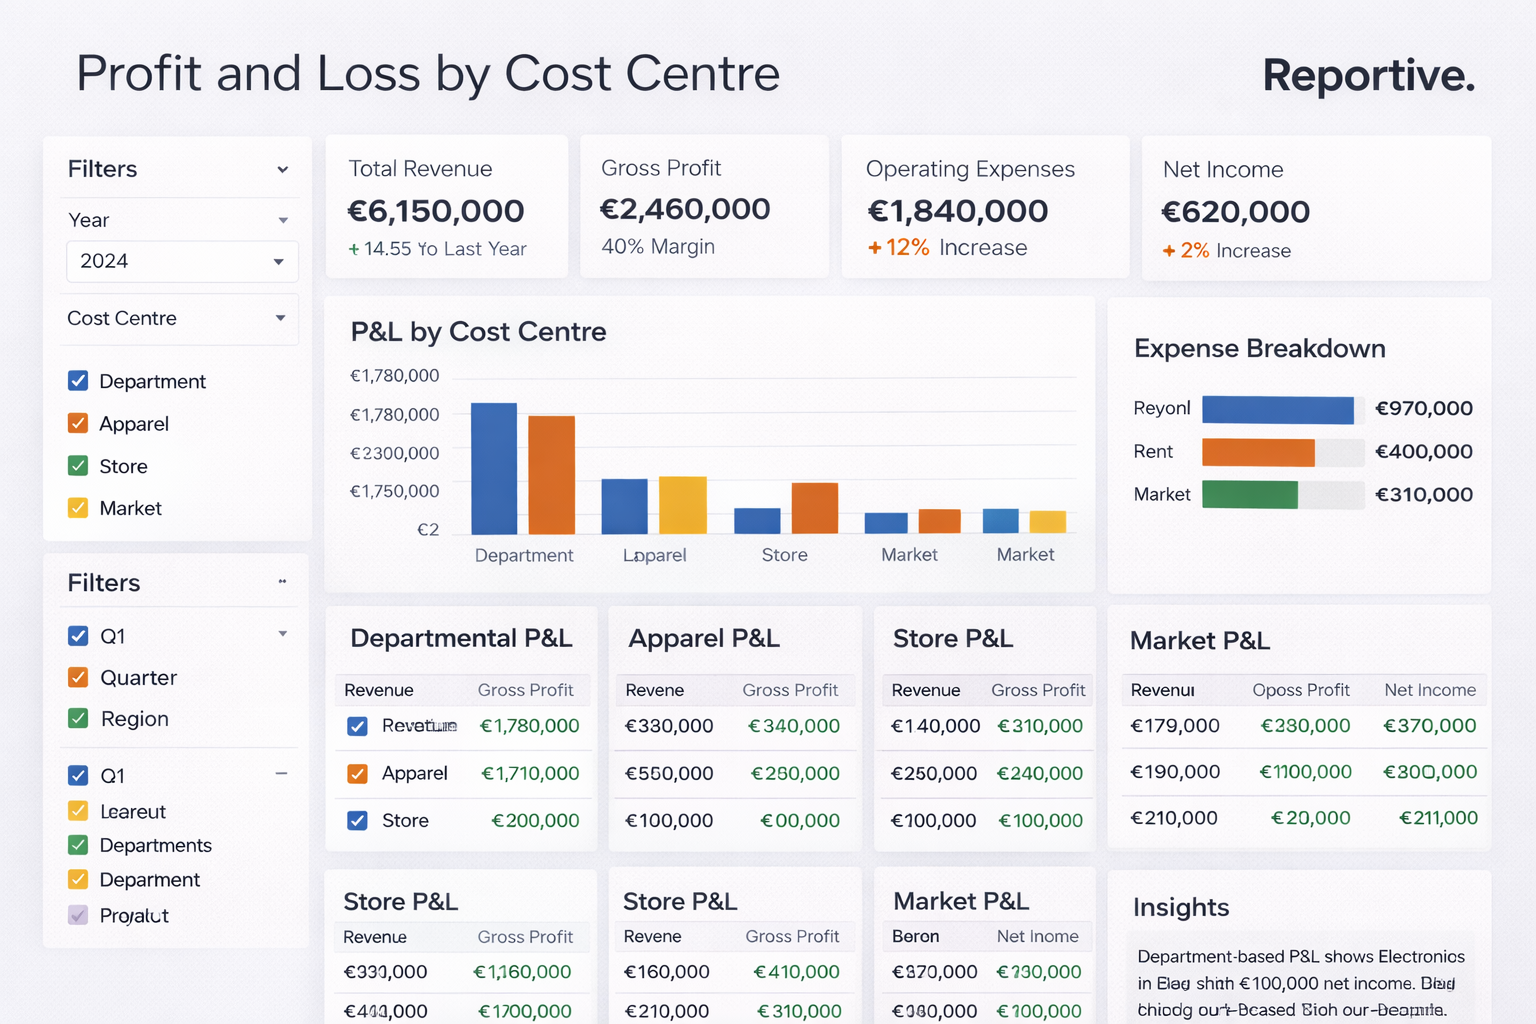
P&L by Cost Centre
Department, location, store, or market
- A clear profit and loss view for every unit, side by side
- Compare like-for-like across teams on one common structure
- See at a glance which areas generate profit and which absorb cost
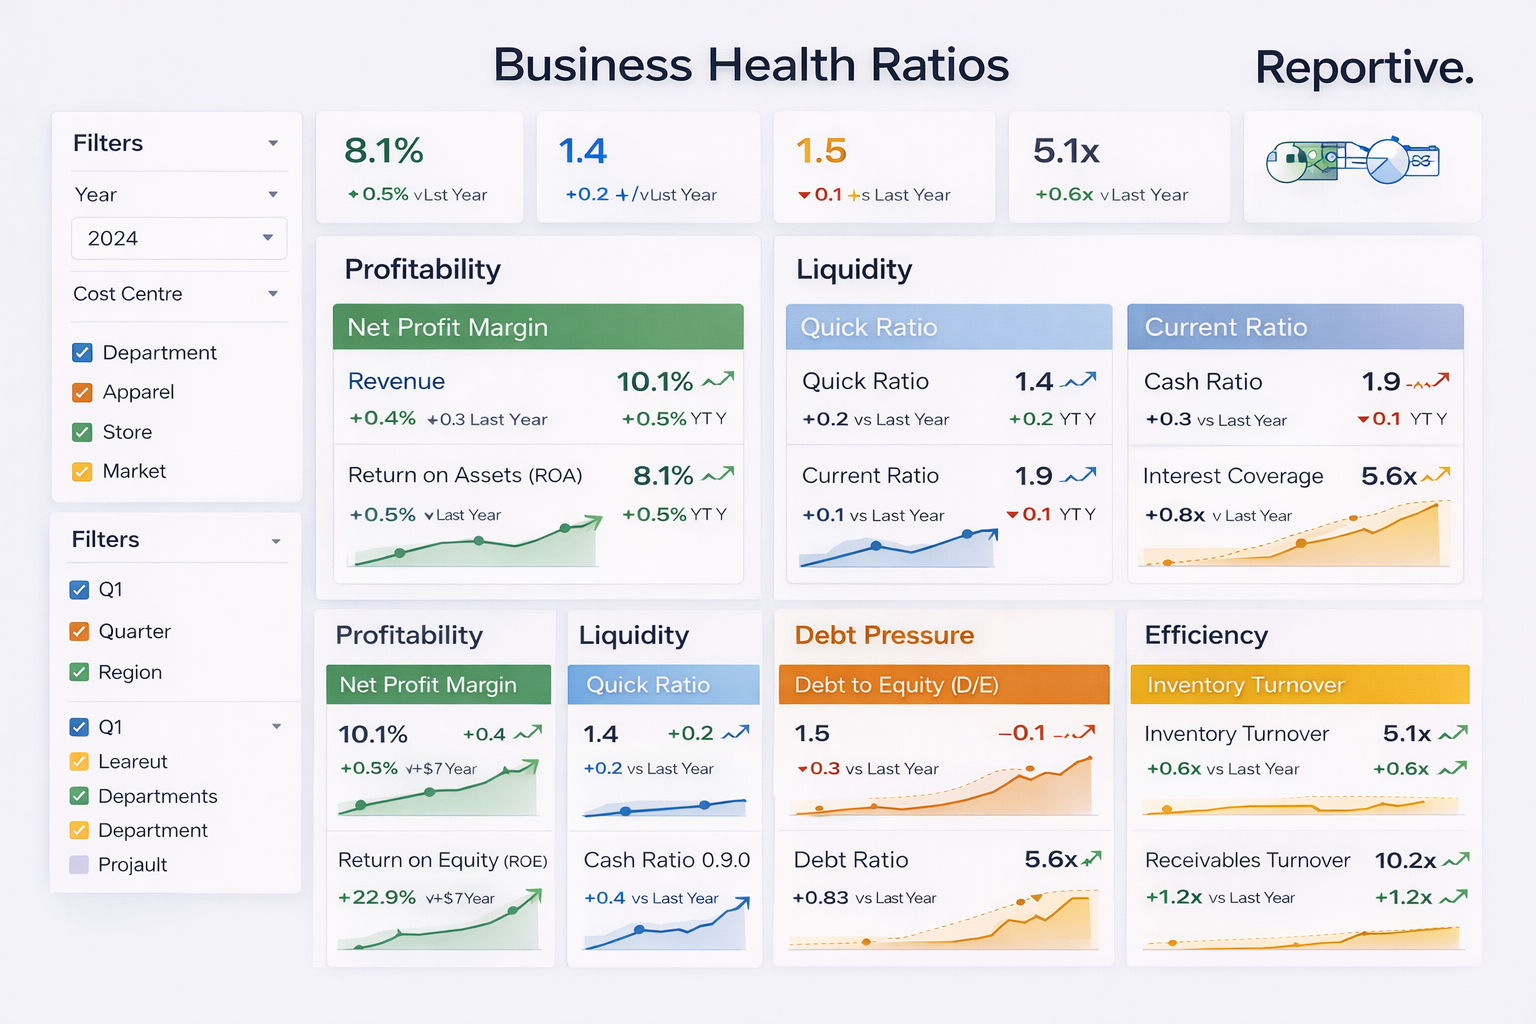
Business Health Ratios
Profitability, Liquidity, Debt pressure and Efficiency
- A simple set of KPIs built for operational control
- Fair benchmarking, with ratios compared across departments on equal terms
- Surfaces efficiency gaps and cost drift before they spread