Data Analysis and Visualization
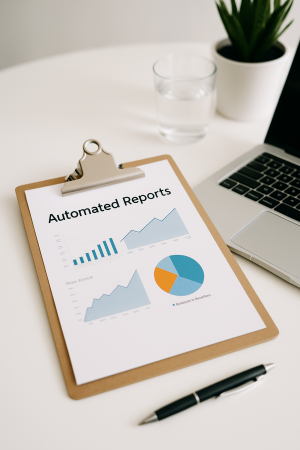
Easy to Understand Visual Dashboards
- Turn complex data into simple screens you can read in seconds
- Clear charts and KPIs that answer “what changed?” at a glance
- Works smoothly on laptop, tablet, and mobile
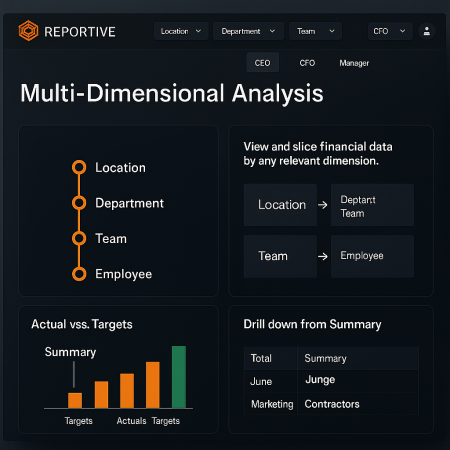
Multi Dimensional Performance Views Slice the numbers your way
- Break performance down by location, department, team, product, or customer group
- Start from the big picture and drill into the real drivers behind it
- Compare month-on-month, quarter-on-quarter, and year-on-year to spot the patterns