Cost Centre & Department Dashboards

Financial Analysis & Reporting

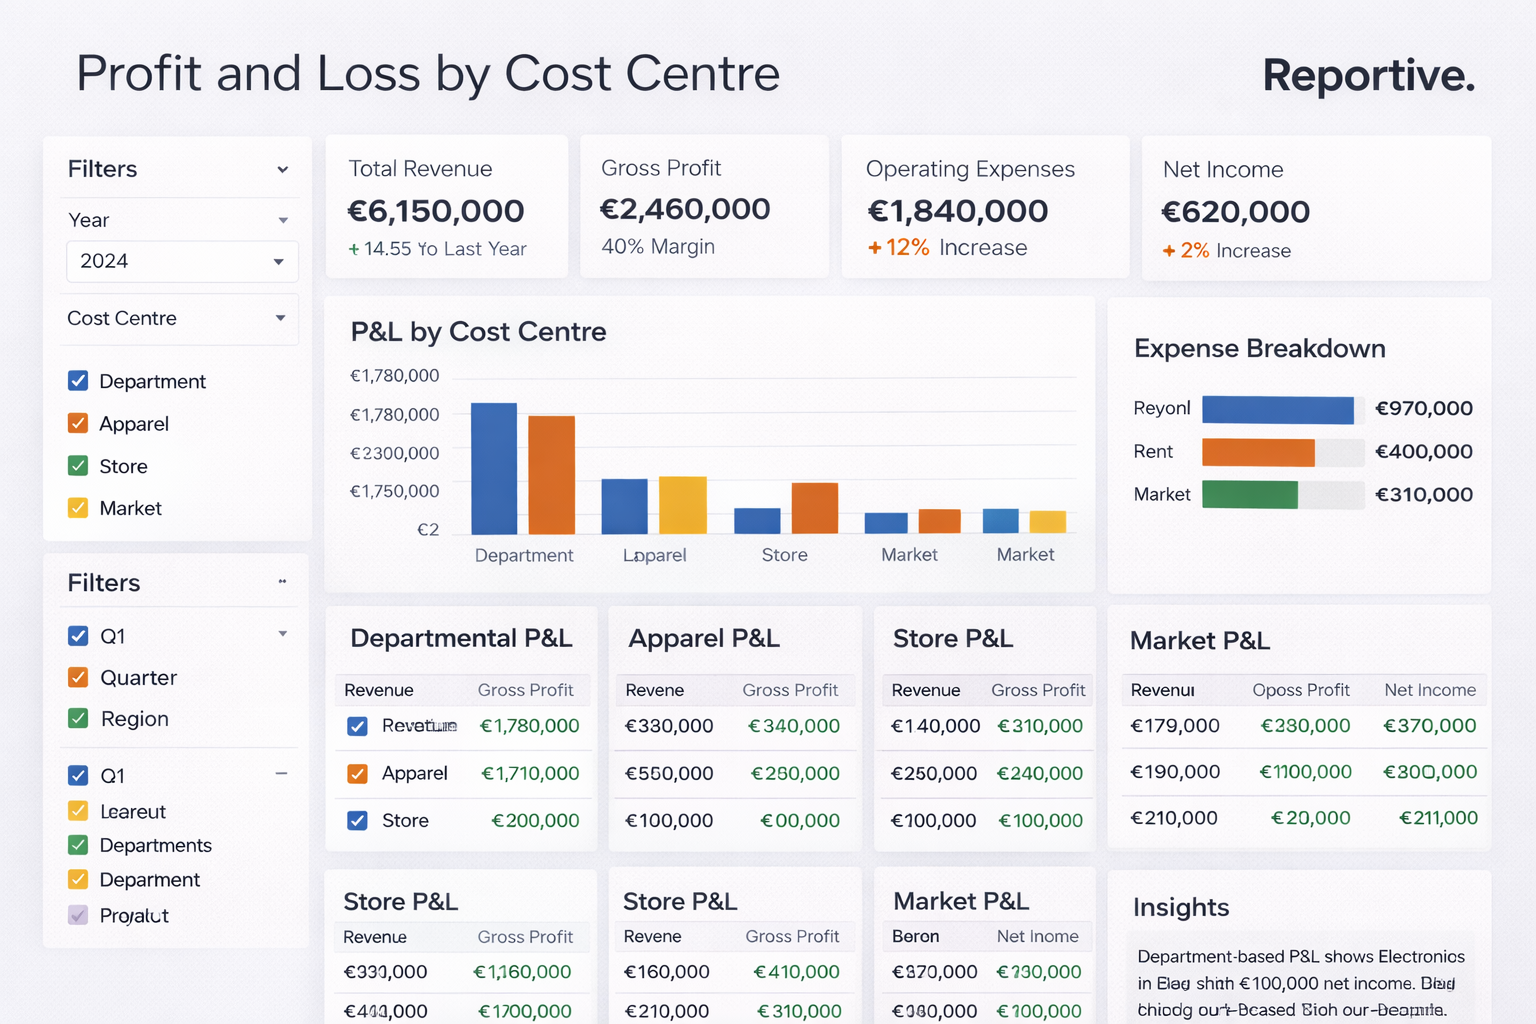
P&L by Cost Centre

Department, location, store, or market

  • A clear profit and loss view for every unit, side by side
  • Compare like-for-like across teams on one common structure
  • See at a glance which areas generate profit and which absorb cost

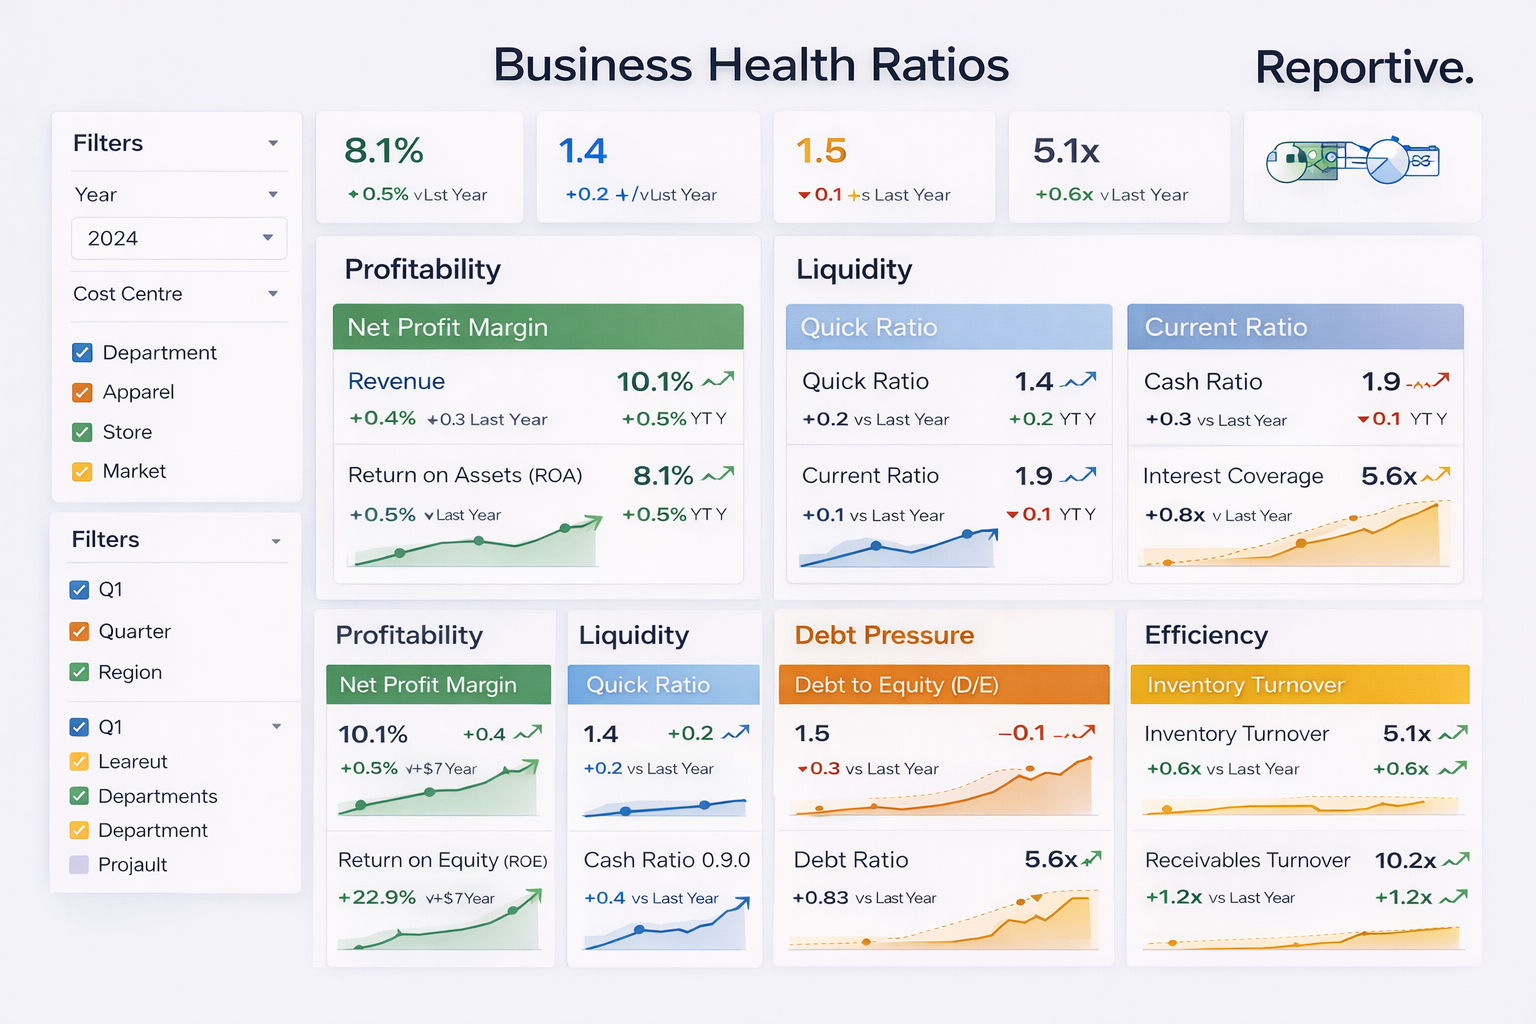
Business Health Ratios

Profitability, Liquidity, Debt pressure and Efficiency

  • A simple set of KPIs built for operational control
  • Fair benchmarking, with ratios compared across departments on equal terms
  • Surfaces efficiency gaps and cost drift before they spread
Financial Analysis & Reporting

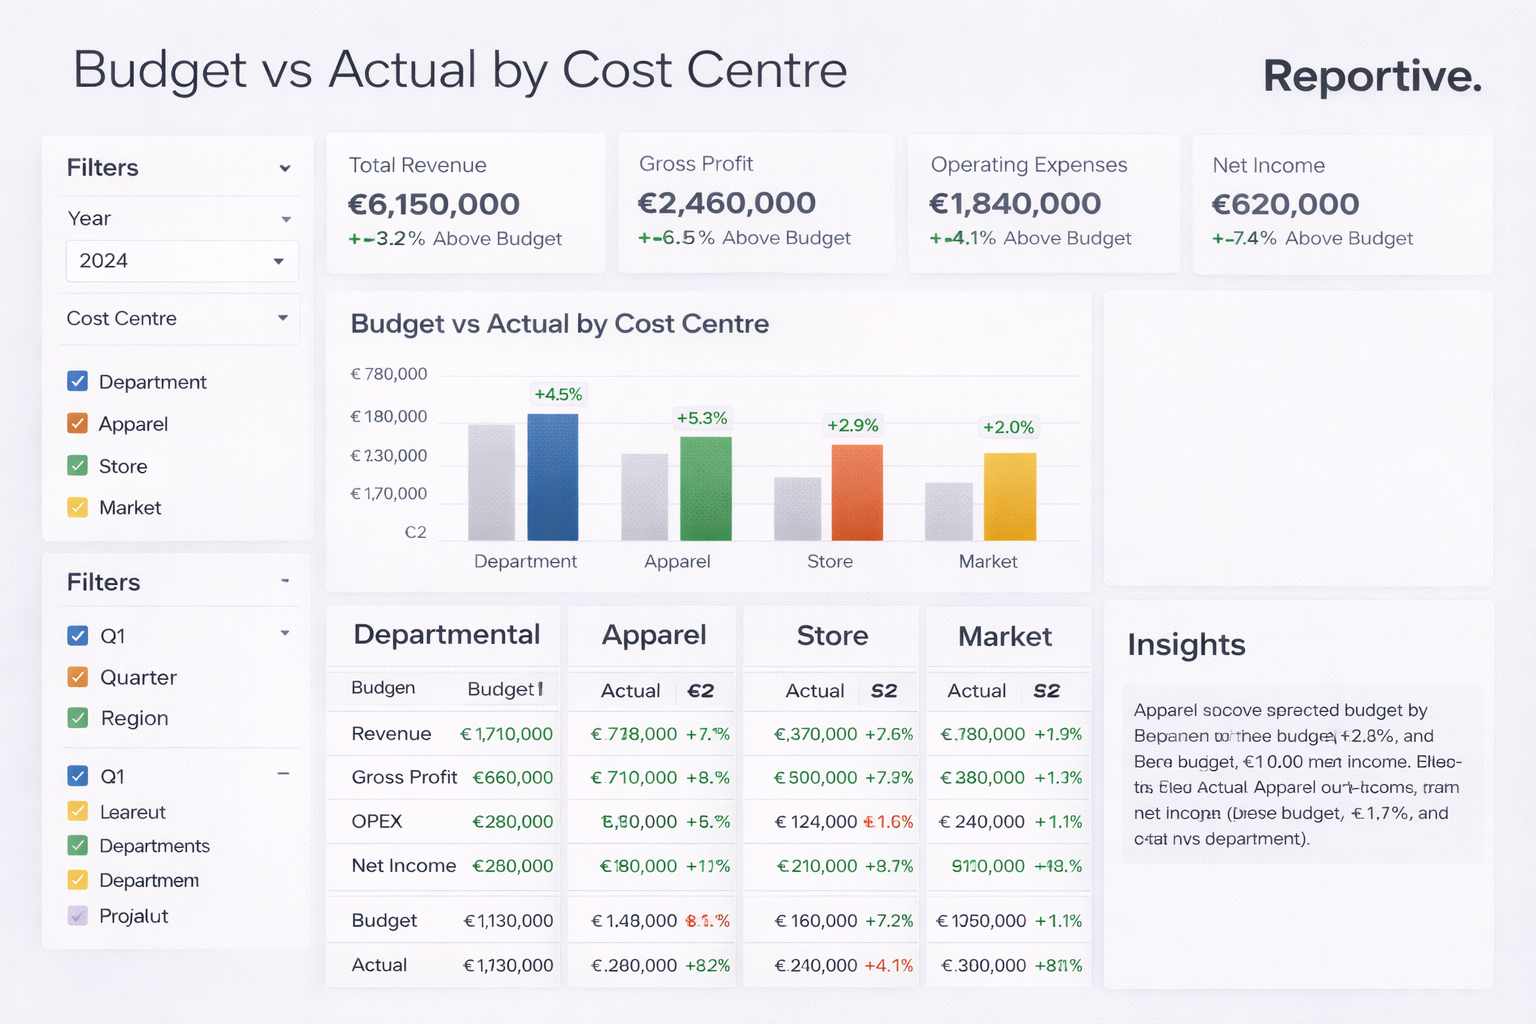
Budget vs Actual by Cost Centre

  • Track variance by unit and by category, clearly
  • Understand what actually drove each variance, not just the size of it
  • Turn variance into action, not just another number on a report

Manager-Ready Views

Ownership and accountability

  • Every manager sees the performance of their own department
  • Simple “on track / off track” indicators that need no explaining
  • Teams spot the problem and self-correct before month-end, not after
Financial Analysis & Reporting

One Common Structure

For Easy Comparison

  • Standardised reporting layout across units
  • Consistent definitions and categories
  • Supports faster decisions and cleaner leadership discussions

Have a project in mind? Let’s get to work.