

Services / Income and expense analysis
Every line of income and every line of cost, explained.
Not only whether costs went up, but which account, in which month, by how much, and against what budget. Down to the last level of your chart of accounts.
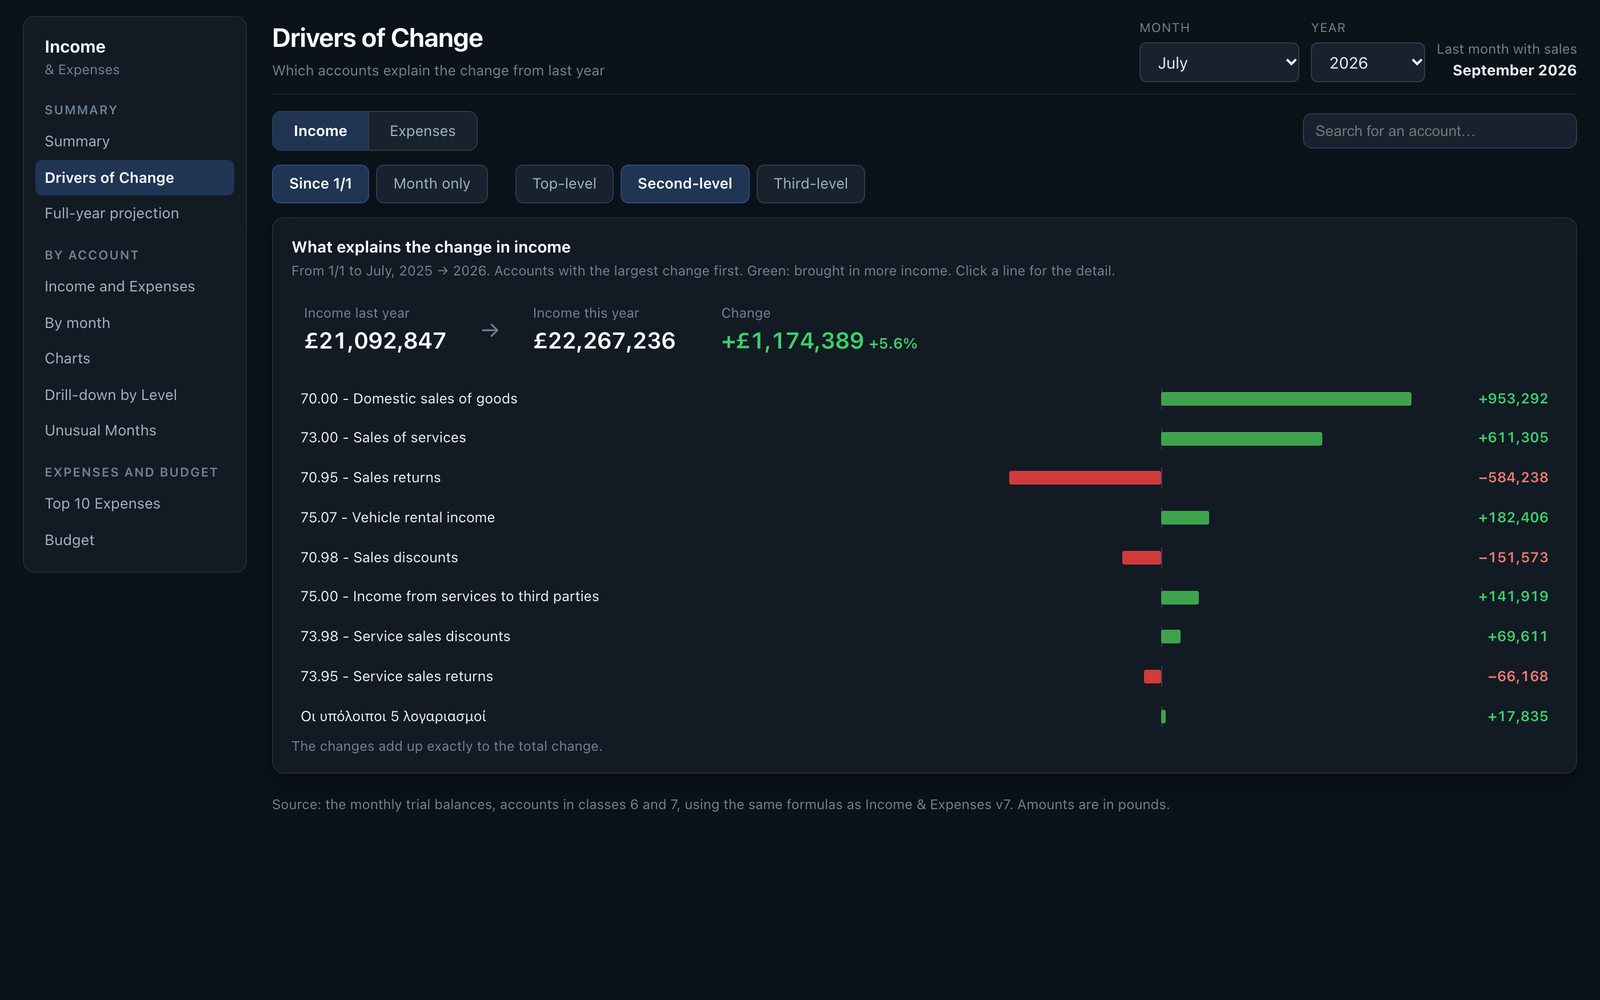
Why did income change from last year?The accounts behind the change, the largest first, adding up exactly to the total.
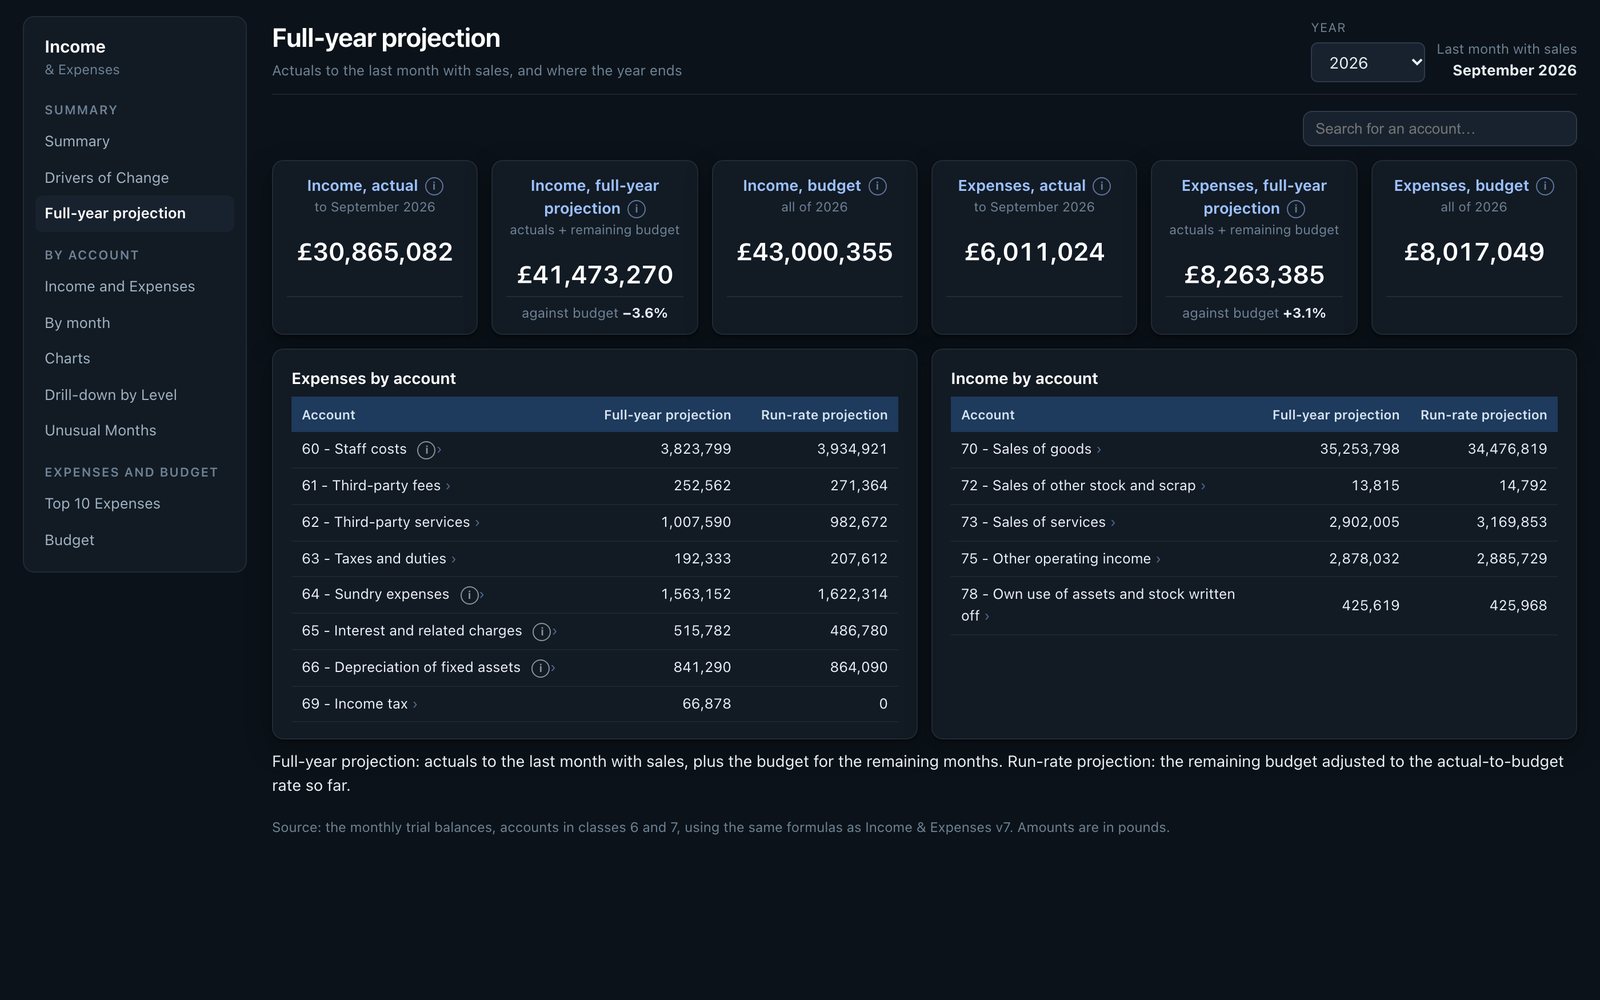
Where will the year close?Actual to date plus the budget for the months left, and the same adjusted to the pace you are running at.
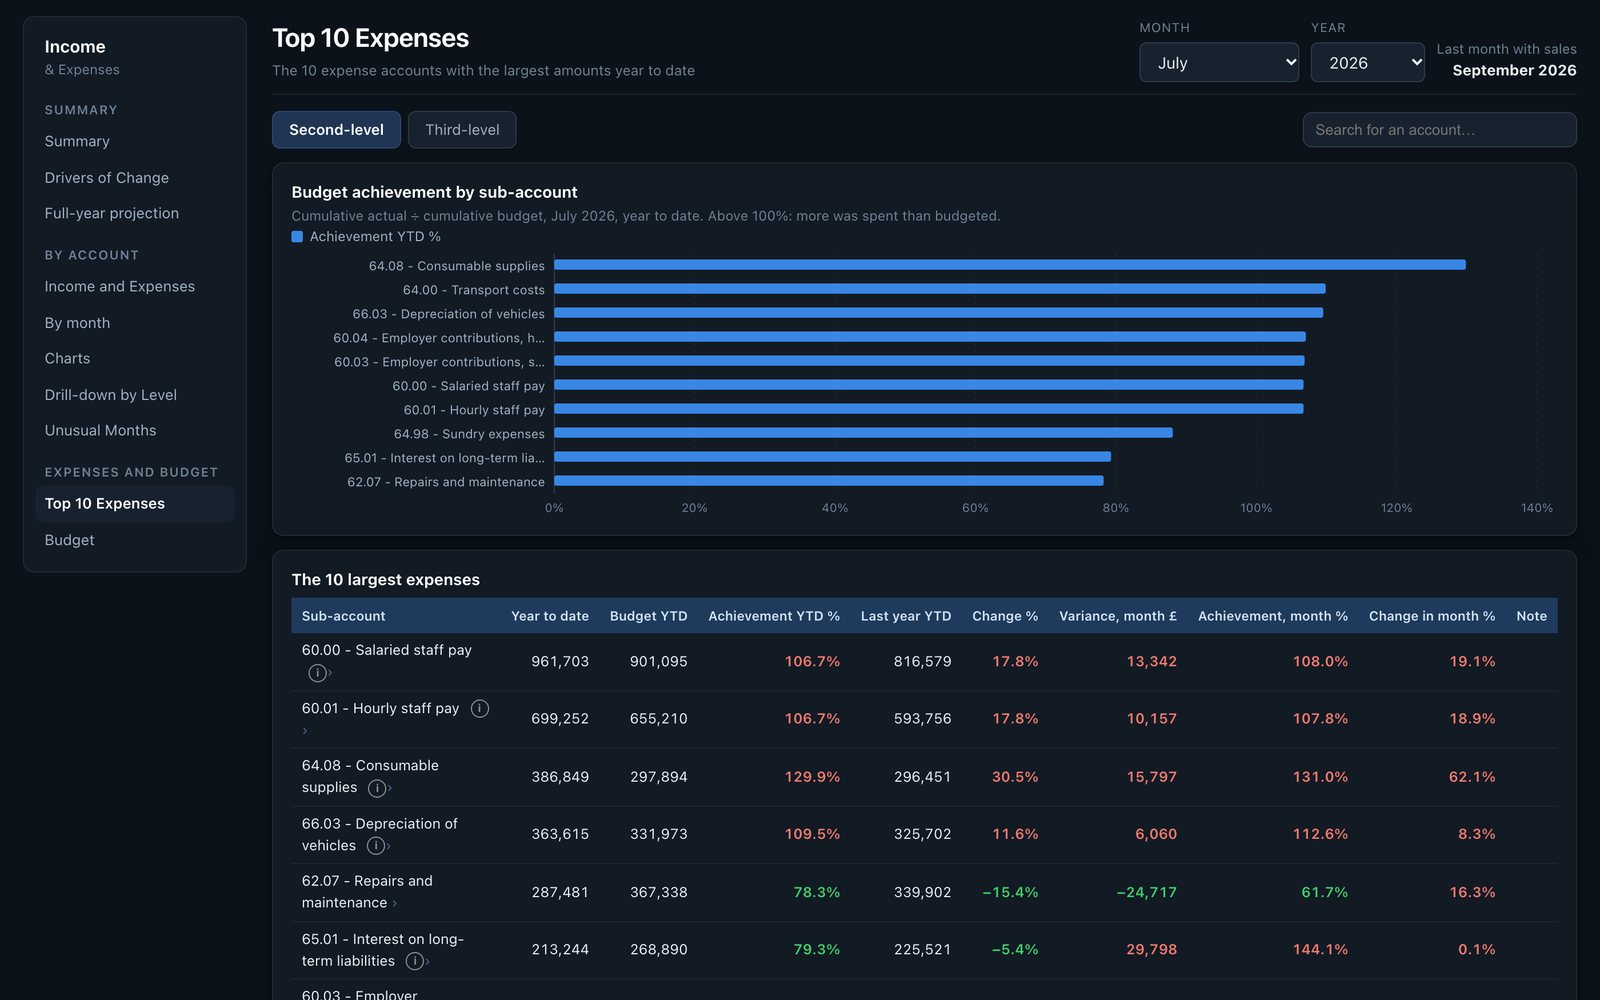
Which costs are running away?The ten largest expense accounts against their budget, and the months that stand out from an account's usual level.
What is included
What you actually receive.
- Every level of the chart of accounts. From the first digit down to the last sub-account, with a search box for any account.
- Month by month. Every account across the twelve months, so a single heavy month stands out.
- Unusual months. Accounts that are well above their usual level this month, flagged automatically. Often a large sale, or several months booked at once.
- Budget, account by account. Your budget loaded once, and every month compared with it, cumulatively and for the month alone.
- Against last year. Every figure next to the same period last year, on exactly the same basis.
- Click any line. Every account opens into its sub-accounts and its months, down to the figure in the trial balance.
The other reports
Back to all servicesUnderstand the past. Command the present. Shape the future.
Send one month of data. See your own business in the dashboards.
A trial balance and one month of sales is enough to build a working preview.
contact@reportive.io