
Services / Sales performance
Turnover tells you how busy you were. This tells you what it was worth.
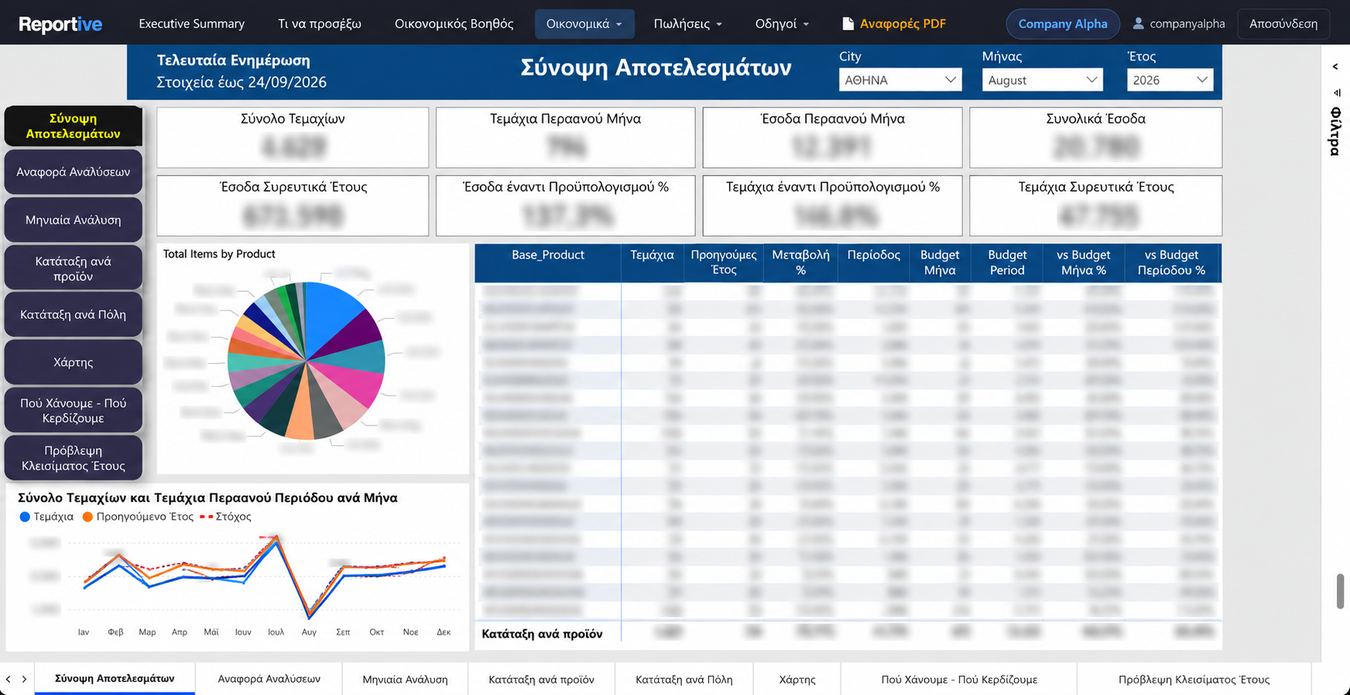
Revenue, units and margin broken down the way you sell: by product, location, channel, customer and salesperson, against budget and against last year.
Where are we winning and losing?Products and locations ranked by growth and by margin, not only by size.
Are we on target?Month and cumulative against budget and last year, with a projection of where the year closes if nothing changes.
What does the team see today?Where your systems can feed data daily, the sales team opens today's position instead of last month's report.
What is included
What you actually receive.
- Ranking by product and customer. Top and bottom, by value and by margin, with the movement against last year beside each.
- Geography. Performance by city or region, on a map when that is how the territory is run.
- Budget tracking. Month, period and year to date against plan, for the company and for each salesperson.
- Where we win, where we lose. The lines that gained and the lines that slipped, named, rather than a net figure that hides both.
- Year end projection. Where the year closes on current trend, so a gap is visible while there is still time to close it.
- Daily refresh where possible. Set up wherever your systems can supply the data that often.
The other reports
Back to all servicesUnderstand the past. Command the present. Shape the future.
Send one month of data. See your own business in the dashboards.
A trial balance and one month of sales is enough to build a working preview.
contact@reportive.io